|
<< Click to Display Table of Contents >> Manual S Performance Data Example 1 |
  
|
|
<< Click to Display Table of Contents >> Manual S Performance Data Example 1 |
|
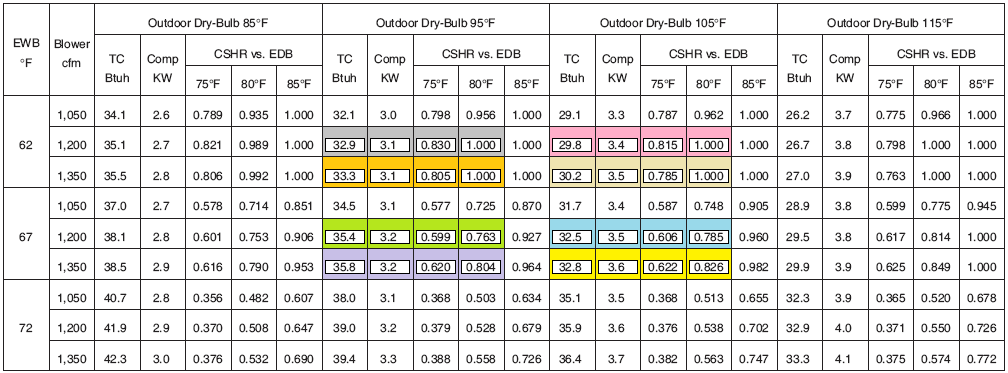
Here's an example of entering values from a typical manufacturer's air conditioner or heat pump cooling performance data table into the Manual S Performance Data page. The cells with shaded colors in the performance data table correspond to the colored input cells in the screenshot that follows.
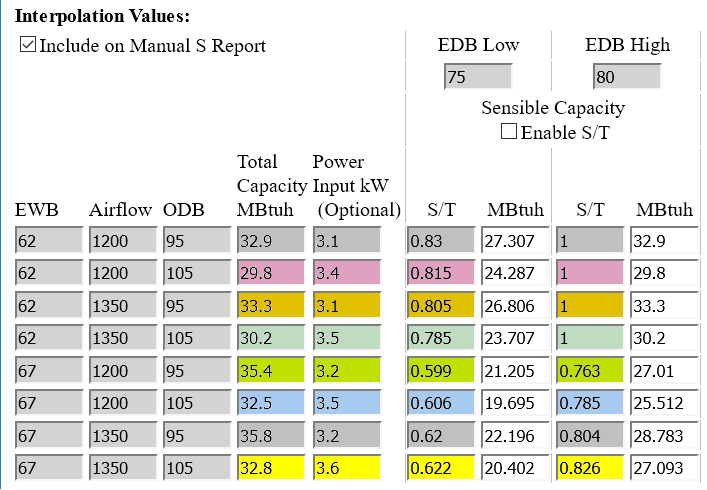
In this example none of the values in the Design column of the Interpolation Conditions area of this page exactly match any of the parameters of the manufacturer's table. For example, the outdoor dry bulb is 99 degrees, but the table has 95 and 105 degree sections. So we need to keep each of the Interpolation Conditions checkboxes checked, and fill in all 32 inputs in the Interpolation Values table (you only ever need to fill in 2 of the 4 columns under Sensible Capacity).
Since the "TC Btuh" column in the manufacturer's table shows values in units of 1000 Btuh, set Capacity Units to MBtuh (it's also sometimes called MBH or KBtuh). That way we can enter the numbers exactly as they appear in the table.
Let's examine the first row of values in the Interpolation Conditions area, where the screenshot at the bottom of this topic shows them filled in with a dark gray color. Notice that the "EWB, Air Flow, ODB" grid to the left of the inputs has values of 62, 1200 and 95. So in order to fill in the numbers we need to find the part of the table that has 62 for EWB, 1200 CFM of airflow, and 95 degrees outdoor dry bulb. As you can see in the screenshot of the manufacturer's table immediately below, the boxes shaded in dark gray meet all those requirements.
For the inputs under Sensible Capacity we have a choice to fill in either the two S/T columns or the two MBtuh columns. When you fill in the S/T column the MBtuh column is filled in automatically, and vice-versa. Since the manufacturer's table provides sensible-to-total ratios in the columns labeled, "CSHR vs. EDB" we need to fill in only the S/T columns.
Since this table provides all the data needed about the air conditioner we don't need to change anything in the Other Adjustments area of the page. The results show that the unit's total capacity is about 115% of the load, while its sensible capacity is 110% of the sensible part of the load.